Key points
“At Man Group, our goal is to lead the way in RI with a more insightful solution that makes a better difference. We call it Intelligent RI.”
The application of carbon constraints has become common practice in ESG portfolios. Investors often ask us how much below benchmark should carbon emissions/intensity be constrained in their portfolios. In many ways, the industry has settled on simple heuristics. For example, we have seen most investors ask for 30-50% below benchmark using historical carbon intensity data.
But is that enough to achieve our goals for a cleaner, greener world? In particular, what does it take for a portfolio[1] to be aligned with net zero and the Paris Accord goal?
Two Degree Alignment Versus Net Zero
The Science Based Target Initiative (‘SBTI') - a joint initiative between key players such as CDP, United Nations Global Compact, World Resources Institute (‘WRI') and World Wide Fund for Nature (‘WWF') - established requirements for the net-zero standard. One key principle behind the standard is that there should be "no net-zero claims until long-term targets are met", which for most companies means long-term target emission reductions of at least 90-95% by 2050. Hence, to be ‘net zero', a portfolio should, in theory, be relatively carbon free. This implies that a portfolio with a carbon budget 30-50% below benchmark, a current industry common practice, is inadequate for a net zero claim.
Building a Paris-Aligned Portfolio
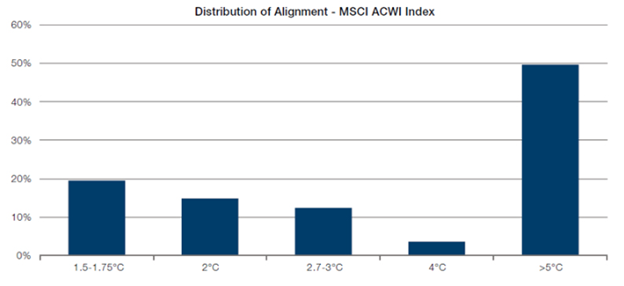
A quick study of the SBTI 2-degree alignment data paints a picture that is somewhat bleak: only 34.3% of companies in the MSCI ACWI Index are aligned with the 2-degree goal (1.5-1.75 and 2-degree buckets), and a mere 19.5% of companies are aligned with the 1.5-degree goal (on the path to net zero, Figure 1).[2] A look at emissions trajectory by sector shows a similar picture where many sectors are also not 2-degree aligned. For an ESG manager focused on making a difference, it is imperative to focus on future alignment when evaluating companies for possible investment and/or engagement. The manager should recognise that certain companies are more predisposed to higher emissions than others. Instead of punishing the cement or steel company, it is the company's future plans for committing resources or capital that are more important, in our view.
Figure 1: SBTI Emissions Alignment (% Count) by Various Warming Scenarios

Source: Trucost, SBTI; as of 20 November 2021
Similar to historical carbon emissions data, careful attention also needs to be paid to the distribution of the data and the implications of applying the data as another constraint.
Most importantly, and very much like applying carbon constraints, we believe it is possible to build portfolios with a 1.5-degree alignment constraint that do not have significant industry and factor biases. This is in spite of the fact that only 19.5% of companies in the MSCI ACWI Index meet this requirement. Thankfully, the skewness in the data allows the emissions of companies above budget to be offset with companies that are meaningfully below budget. In addition, larger-cap companies also tend to be the companies under budget, making it easier for us to achieve the constraint for portfolios tethered to cap-weighted indices. Going forward, we believe this goal should be easier to achieve as more companies commit to having their operations net zero and as more technology becomes available to help them achieve those goals.
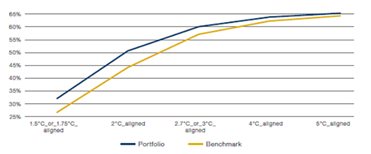
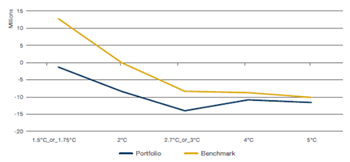
Indeed, while the weight of companies in benchmark that are 1.5-degree aligned is less than 30% (Figure 2a), we can build a portfolio that has a meaningful different projected emissions alignment (Figure 2b) compared with the benchmark. In our hypothetical portfolio, the weighted average overall carbon emissions in a 1.5-degree warming scenario is below zero (under budget), compared with the benchmark, which is more than 10 million cumulative tCO2e over the 1.5-degree budget (2025 horizon). In fact, very much like carbon constraints, our research indicates that the resulting portfolio has: 1) no meaningful sector tilts; 2) no noticeable impact on performance; and 3) no significant style drift: an interesting outcome given the percentage of companies in the universe that are Paris-aligned.
Figure 2: Hypothetical ACWI Climate Portfolio Versus MSCI ACWI Benchmark
2a) Percentage Weight Alignment under Various Warming Scenarios

2b) Emission-based Alignment under Various Warming Scenarios

Source: Trucost, SBTI; as of 30 November 2021
The above contains hypothetical or simulated model results that have certain inherent limitations. Unlike an actual portfolio record, simulated results do not represent actual trading. Also, since the trades have not actually been executed, the published results may have under-or-over compensated for the impact, if any, of certain market factors, such as lack of liquidity. Simulated trading programs in general are also subject to the fact that they are designed with the benefit of hindsight. There exist limitations inherent with model results. Results include simulated transaction costs, but do not include the impact of actual trading.
Conclusion
Building a 1.5-degree aligned portfolio is very much like building a portfolio with a carbon constraint, in our view. The skewness in the data allows for portfolios - that are aligned with almost no noticeable industry and factor biases - to be built.
To be successful, however, we believe investors should choose managers that: 1) have a tangible track record of building portfolios with carbon budgets; and 2) are equipped with all the necessary tools to build 1.5-degree aligned portfolios that minimise the impact on other portfolio objectives.

This post is funded by Man Group
[1]There are two types of net zero claims being made: 1) Net zero claims by corporations eliminating carbon emissions from their own operations; and 2) Net zero claims made by investment managers to eliminate emissions from their portfolio holdings. The latter is often some weighted version (based on portfolio holdings) of the former.
[2] As of 20 November 2021


