
Travel agencies include both conventional brick-and-mortar agencies and online travel agencies or OTAs. Brick-and-mortar travel agencies typically offer more personalized, value-added services (for which they may charge fees) than OTAs. OTAs generally confine themselves to aggregating and displaying availability and price data for flights, hotels etc., along with some travel-related content, for example, things to do or local photographs. OTAs leave it to the clients to choose the most suitable option, which they can book through the OTAs. Online travel agencies should not be confused with travel service provider (e.g., airline or hotel) websites, which are limited to selling the provider's services and possibly those of its sales partners.
Revenue Performance
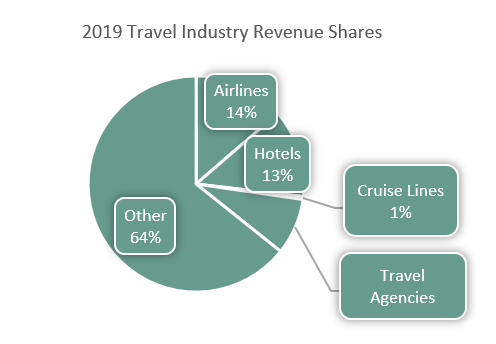
Travel agencies form an important segment of the travel and tourism (T&T) industry, with revenues of $517 million or over 8% of total T&T revenues in 2019, a smaller share than either airlines or hotels, but more than the cruise industry[1].
Travel agencies, like the rest of the travel industry, were hard-hit by the pandemic and had not yet fully recovered as of the end of 2021. Global travel agency revenues, including both brick-and-mortar and online travel agencies, were an estimated $329 billion in 2021[2]. Despite the rapid growth of the OTA segment, brick-and-mortar agencies still generated over 88% of total travel agency revenues in 2021.
We expect travel agency revenues to climb by 11%, to $366 million, in 2022. However, we do not expect them to recover to pre-pandemic levels until 2025 at the earliest, which would work out to a CAGR of 12.1% in 2023 - 2025. Somewhat surprisingly, brick-and-mortar agencies are projected to maintain or even slightly increase their market share over the next three years as depicted in the graph opposite. A 2023 recession in the US, Europe, and other major markets, which is widely expected, could set the recovery of the travel agency industry back as far as 2027.
Market Drivers
Major factors driving the recovery and eventual renewed growth of the travel agency industry include: trends in overall travel spending, changing consumer preferences, and changes in travel agencies' business models.
Overall travel expenditures affect travel agency revenues, both directly in terms of fees the agency charges travellers for its services, and indirectly in terms of sales commissions the agency collects from travel service vendors. As a result of the pandemic, total global spending on leisure and business travel fell by approximately 50% between 2019 and 2020, to $3.2 trillion. With the rollout of COVID-19 vaccines and the gradual relaxation of restrictions on public movements, global travel expenditures rebounded to an estimated $5.1 trillion in 2021. As of late 2022, global travel expenditures seem on track to recover to pre-pandemic levels by 2024.
Brick-and-mortar travel agents have also been more able than OTAs to adapt their business models to changes in the travel industry, e.g., by making up for reductions in the commissions they receive from travel service providers by introducing or increasing service fees such as consultation fees, research fees, or booking fees[3]. As a result, they are better positioned than OTAs to benefit from the upward trend in travel spending.
Overall, travellers have been growing more informed, more empowered, and better able to organize their trips independently than previous generations of travellers, a trend that has fuelled the growth of OTAs. This trend reached a high point among Baby Boomers (people born between 1946 and 1964), 72% of whom reportedly prefer to organize their own travel arrangements using online resources such as OTAs[4]. Somewhat surprisingly, younger travellers in the Gen X demographic (born (1965-1980), Gen Y/Millennials (1982-1996), and Gen Z'ers (1997-2012) appear significantly less likely than Baby Boomers to use an OTA to make their travel arrangements[5], [6]. These demographic trends help to explain brick-and-mortar agencies' continued resilience.
Stock Performance
Reflecting their comparatively favourable business fundamentals, travel agency stocks as a group have outperformed other travel and tourism shares over the last three years. The accompanying chart compares average returns from a group of selected travel agency shares[7] with trends in the DJUSTT index.
The Travel UCITS ETF (TRYP) offers investors access to the travel sector, including airlines, hotels, cruise lines, and travel agencies.
This post is funded by HANetf
[1] https://www.digitaljournal.com/pr/online-travel-agency-market-size-share-growth-and-forecast-2021-2027#ixzz7lxb6Nzk4
[5] https://www.hotelmize.com/blog/travel-trends-by-age-demographic-age-as-the-key-factor-in-tourism/
[7] Including shares in BKNG, YTRA, AXP, SABR, EXPE, MMYT, TRIP, DESP.


