Key points
- 2021 was a record year for dividends around the globe
- Robust earnings growth and more pent-up demand are reasons to be optimistic for 2022
- Rising interest rates, inflation, and reduced central bank and fiscal support mean this could be a year that separates the wheat from the chaff
- We believe dividend strategies that focus on quality companies are poised to benefit the most in such a scenario
Just as investors were getting ready to close their books for the year and head out to the pub for their team Christmas drinks, Boris Johnson had a message for them: Plan B. Unwelcome news for sure, but after almost two years of on-and-off lockdowns, markets were hardly surprised. The real, and more consequential surprise came roughly a week later on the 15th of December, when the Bank of England hiked rates to 0.25% and did so with a majority of 8-1.1 Citing a tightening labour market and persistent cost pressures globally, the MPC argued that inflation concerns outweighed the risk from the then nascent Omicron spread and a hike was warranted.1 While this decision puts the Bank slightly ahead of major peers like the Fed and the ECB, the core message is similar across the globe. Inflation may prove to be more than transitory, economic slack is diminishing, and rate hikes will eventually be on the cards, once QE tapering comes to an end.
When we speak to investors, one question that keeps coming up revolves around dividend stocks, and how they might be affected by a more hawkish environment. We believe that dividends can offer an opportunity as an inflation play and even act as a hedging strategy, if implemented correctly. That means that a high dividend yield should not be the only criteria. After all, the yield may be high because of a poor performance of the stock for good reason. It may even spell trouble regarding the sustainability of the dividend going forward. It's equally important to look at the underlying fundamentals of the companies, in particular earnings power, potential growth, and balance sheet strength.
Rising Rates and Dividends - Mixed Evidence
Dividend strategies are attractive as real interest rates may stay low for quite some time if inflation persists. Equities represent a claim on the income and assets of a company, and some companies may be able to fully or partially pass on higher prices to their customers. Certain sectors, especially finance, are even poised to benefit directly from higher interest rates. More generally, a rising rate environment can signal market confidence in future business prospects and earnings that can translate into higher dividends.
On the other hand, some research suggests that in scenarios with rising rates, global high dividend yield stocks tend to underperform. That is even more true where the long end of the curve rises faster than the short end, much like what we have been witnessing over the past 18 months or so.2 In such environments between 1994 and 2021, high dividend yield companies lagged the overall market by around 0.9% on a monthly basis (MSCI, 2022). Such empirical findings are broadly consistent with valuation models and simple maths; as discount rates rise, the present value of future cash flows, including dividends, decreases. But nominal interest rates are only one component of the discount rates the market applies. Another key ingredient are growth rates, or, more specifically, expected sustainable growth rates. As cashflows to investors grow faster, higher discount rates can directly be offset.
Not All Dividend Strategies Are Created Equal
Investors should be interested in the ability of a company to sustain or even grow its dividends over the long run. Expected growth rates are subject to a myriad of assumptions and a large degree of uncertainty. But a useful and well grounded growth approximation for a mature dividend paying company is a function of its profitability - return on equity - and its retention rate (i.e. the share of profits that is not distributed to shareholders). The more a company earns, the more can be distributed. The part of income that is not paid out can be used to finance future growth, and ultimately, future profits and dividends.
With that economic model in mind, we have had a look at three global indexes; one that focuses primarily on high dividend yield companies; one that considers yield but also quality criteria like return on equity and leverage; and, for reference, the standard market index.
The dividend yields for the three index strategies as of Q4, 2021, were as follows:
Quality Dividend: LibertyQ Global Dividend Index 3.65%
High Dividend Yield: MSCI ACWI High Dividend Yield Index 3.66%
Benchmark: MSCI ACWI ex-REITs Index 1.74%
The yields of both dividend indexes are currently comparable, but how did these strategies fare in terms of our key metrics, profitability (as indicated by return on equity), and retention rates, through the pandemic?
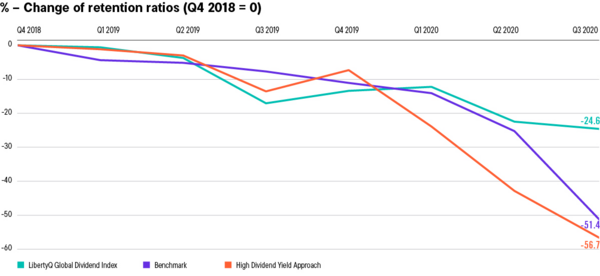
Both dividend indexes had comparable retention rates of around 40% at the end of 2018. That means that for each dollar of net income they paid 60 cents to investors, and kept 40 cents as retained earnings. At the end of 2021, these rates were slightly higher at 47% and 48%, respectively. For reference, the benchmark retention rates were 55% and 60% for these points in time.4 Overall, not that much seems to have happened. However, the quality aspect came into full play during 2020, when most economies had to shut down due to covid. In Q3 of 2020 (i.e. the quarter following the first lockdowns), the high yield approach retention rate was down to 19%. That's less than half of its pre-pandemic levels and means that these companies paid out over 80% of their profits - and kept only 19% as a cushion or in order to finance future growth.
It is important to note here that the interpretation and comparison of retention ratios at a single point in time is not very useful on its own. However, taking the information above in the context of the coronavirus pandemic we can get a pretty good idea of what happened. Companies found themselves in a position where they either made no profit or much less than usual; in this sense, we can unequivocally state that drops of 50% and more in the retention rate are a sign of trouble; the 25% reduction in the quality dividend strategy is much more consistent with companies that were able to distribute cash to their shareholders and still manage to retain a healthy amount of their earnings.

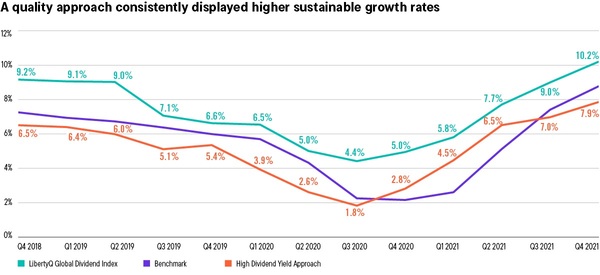
This becomes even clearer by looking at the retention rates in combination with a company's profitability. As discussed above, taken together, these metrics can give us a sense not only of the current state of business, but also of future growth prospects. We find that both before, during, and after the height of market volatility and lockdowns, the LibertyQ Global Dividend Index, applying a strict quality screen, fared best relative to other comparable indices. It exhibited consistently higher sustainable growth rates and a relatively shallower drop during the turmoil. A higher growth rate means that the underlying companies are potentially more likely to have sustainable or growing dividends in the future - that could act as a counterbalance against inflation and rising interest rates.

While it is important to stress that these are not realized, but potential growth rates, they give us a clear indication of how different companies fared throughout the pandemic - and potentially beyond.
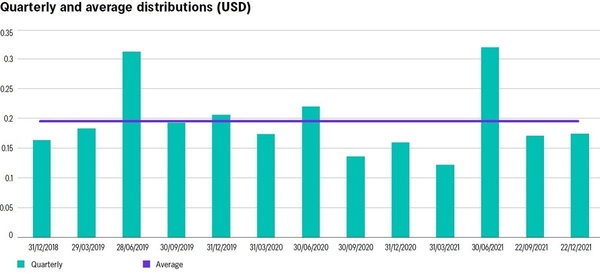
The final element an investor needs to take into account is, obviously, real world return. The above are well grounded concepts, but they are only that - concepts. So what would an investor that wished to obtain a regular income have ended up with by choosing the LibertyQ Global Dividend Index?

While there is a slight dent during the aftermath of the first covid shock, by and large, distributions have been relatively stable. Given the magnitude of events, it further demonstrates the resilience of a dividend approach that puts a strong emphasis on quality aspects, in particular earnings power and leverage.
A Look Ahead - Quality Dividends for 2022
We have laid out the economic rationale for dividends in a rising rates environment and as a potential inflation hedge. However, as the markets adjust to tighter monetary policies around the globe, we believe investors should be more discerning than ever - high dividend yields alone will not be good enough. Besides pure yield, the focus should be squarely on profitability and balance sheet strength as both are important in assessing the sustainability of dividends going forward. Quality dividend strategies like the Franklin LibertyQ Global Dividend UCITS ETF may benefit the most from a normalisation after Covid. They tend to invest in companies with moderate debt levels that may be able to pass on higher prices to customers more easily. Beyond that, quality approaches offer a larger financial cushion than their peers that only focus on high yields, as has been demonstrated during the pandemic shock in 2020. For example, there tends to be an underweight in utility companies - usually high dividend payers, but also often burdened with a high debt load. Within the finance sector, yield focused strategies often are heavily invested in banks. Quality dividend strategies tend to have a more balanced exposure between banks and insurance companies. This is also important from a total return perspective. In fact, dividend sustainability doesn't have be a trade-off against total return; in the 3-year period up to 31st December 2021, the LibertyQ Global Dividend Index posted an average annual return of 16.2%, while the MSCI ACWI High Dividend Yield Index posted 12.9%. Over 5 years, the figures were 11.1% and 9.7%, respectively.5
2021 was a record year for dividends around the globe. With robust earnings growth and more pent-up demand waiting on the sidelines, there is good reason to be optimistic about 2022 and prospects for dividend investors. But reduced central bank support and fiscal stimulus also mean this could become a year that finally separates the wheat from the chaff. We believe a quality dividend strategy is best positioned to benefit from these developments.
To visit the Franklin Templeton website please click here.
Sources
- Bank of England, 15 Dec 2021, https://www.bankofengland.co.uk/monetary-policy-summary-and-minutes/2021/december-2021
- MSCI, 2022, Factors in Focus: Are Your Equity Styles Ahead of the Curve? https://www.msci.com/www/blog-posts/factors-in-focus-are-your/02933279202
- Bloomberg, 2022. The three approaches are represented by the LibertyQ Global Dividend Net Total Return USD Index (Quality Dividend Approach), the MSCI ACWI High Dividend Yield Index (High Dividend Yield Approach), and the MSCI ACWI ex-REITs Net Total Return USD Index (Benchmark).
- The higher retention rate for the benchmark may seem like a quality criteria for future dividends; that is misleading. One can expect dividend strategies to have a lower retention rate than the broad market, as the latter includes companies that pay no dividends at all, or growth companies that invest more and pay out less.
- Based on LibertyQ Global Dividend Net Total Return USD Index (Quality Dividend Approach) and the MSCI ACWI High Dividend Yield Index (High Dividend Yield Approach).
What are they key risks?
The value of shares in the Fund and income received from it can go down as well as up and investors may not get back the full amount invested. Performance may also be affected by currency fluctuations. Currency fluctuations may affect the value of overseas investments.
There is no guarantee that the Fund will meet its objective. The Fund intends to track the performance of the Underlying Index which is comprised of 100 stocks selected from the MSCI ACWI exREITS Index-NR. Such assets have historically been subject to price movements due to such factors as general stock market volatility, changes in the financial outlook or fluctuations in currency markets. As a result, the performance of the Fund can fluctuate significantly over relatively short time periods.
Other significant risks include: Counterparty risk: the risk of failure of financial institutions or agents (when serving as a counterparty to financial contracts) to perform their obligations, whether due to insolvency, bankruptcy or other causes. Foreign Currency risk: the risk of loss arising from exchange-rate fluctuations or due to exchange control regulations. Derivative Instruments risk: the risk of loss in an instrument where a small change in the value of the underlying investment may have a larger impact on the value of such instrument. Derivatives may involve additional liquidity, credit and counterparty risks. Emerging markets risk: the risk related to investing in countries that have less developed political, economic, legal and regulatory systems, and that may be impacted by political/economic instability, lack of liquidity or transparency, or safekeeping issues. Index Related risk: the risk that quantitative techniques used in creating the customised Index the Fund seeks to track do not generate the intended result, or that the portfolio of the Fund deviates from its Index composition or performance. Secondary Market Trading risk: the risk that the shares purchased on the secondary market cannot usually be sold directly back to the Fund and that investors may therefore pay more than NAV per Share when buying shares or may receive less than the current NAV per Share when selling shares.
For full details of all the risks applicable to this Fund, please refer to the "Risk Considerations" section of the current prospectus of Franklin LibertyShares ICAV.
Important Information
This material is intended to be of general interest only and should not be construed as individual investment advice or a recommendation or solicitation to buy, sell or hold any security or to adopt any investment strategy. It does not constitute legal or tax advice. Special risks are associated with foreign investing, including currency fluctuations, economic instability and political developments; investments in emerging markets involve heightened risks related to the same factors. To the extent the fund focuses on particular countries, regions, industries, sectors or types of investment from time to time, it may be subject to greater risks of adverse developments in such areas at focus than a fund that invests in a wider variety of countries, regions, industries, sectors or investments. For the avoidance of doubt, if you make a decision to invest, you will be buying units/shares in the fund and will not be investing directly in the underlying assets of the fund.
Franklin LibertyShares ICAV ("the ETF") investment returns and principal values will change with market conditions, and an investor may have a gain or a loss when they sell their shares. Please visit [insert local web address] for the Franklin LibertyShares ICAVs' standardised and most recent month-end performance. There is no guarantee that any strategy will achieve its objective.
All performance data shown in the fund's base currency. Performance data is based on the net asset value (NAV) of the ETF which may not be the same as the market price of the ETF. Individual shareholders may realise returns that are different to the NAV performance. Past performance does not predict future returns. The actual costs vary depending on the executing custodian. In addition, deposit costs may be incurred which could have a negative effect on the value development. Please find out the costs due from the respective price lists from the processing/custodian bank. Changes in exchange rates could have positive or negative effects on the development in Euro. Please visit [insert local web address] for current performance and see the prospectus for further details. Information is historical and may not reflect current or future portfolio characteristics. All portfolio holdings are subject to change.
An investment in Franklin LibertyShares ICAV entails risks which are described in the prospectus and in the relevant Key Investor Information Document. The Fund's documents are available in English, German and French from your local website.
In addition, a summary of investor rights is available from franklintempleton.lu. The summary is available in English.
Franklin LibertyShares ICAV is notified for marketing in multiple EU Member States under the UCITS Directive. Franklin LibertyShares ICAV can terminate such notifications for any share class and/or sub-fund at any time by using the process contained in Article 93a of the UCITS Directive.
Franklin LibertyShares ICAV (domiciled outside of the U.S. or Canada) may not be directly or indirectly offered or sold to residents of the United States of America or Canada. ETFs trade like stocks, fluctuate in market value and may trade at prices above or below the ETFs net asset value. Brokerage commissions and ETF expenses will reduce returns.
Issued by Issued by Franklin Templeton Investment Management Limited (FTIML), registered office: Cannon Place, 78 Cannon Street, London
EC4N 6HL. Tel: +44 (0)20 7073 8500. Authorised and regulated in the United Kingdom by the Financial Conduct Authority.
© 2022 Franklin Templeton. All rights reserved.
Indices are unmanaged, and one cannot invest directly in an index. They do not reflect any fees, expenses or sales charges.
The LibertyQ Global Dividend Index is a systematic, rules-based proprietary index that is owned and calculated by MSCI Inc. (MSCI) based on the MSCI All Country World exREITs Index that aims to reflect the performance of Franklin Templeton's strategy. The Franklin LibertyQ Global Dividend UCITS ETF is not sponsored, endorsed, issued, sold or promoted by, or affiliated with, MSCI. MSCI does not make any representation regarding the advisability of investing in the Franklin LibertyQ Global Dividend UCITS ETF. The index includes large and mid-capitalisation stocks with high and persistent dividend income in developed and emerging countries globally, subject to a maximum 2% per company weighting. The LibertyQ Global Dividend Index utilizes a dividend screening and quality factor selection process that is designed to select equity securities from the MSCI All Country World exREITs Index that have exposure to persistent payers and quality, while seeking a lower level of risk and higher risk-adjusted performance relative to the MSCI All Country World exREITs Index over the long term.
All MSCI data is provided "as is." The Fund described herein is not sponsored or endorsed by MSCI. In no event shall MSCI, its affiliates or any MSCI data provider have any liability of any kind in connection with the MSCI data or the Fund described herein. Copying or redistributing the MSCI data is strictly prohibited.
Important data provider notices and terms available at www.franklintempletondatasources.com
This post is funded by Franklin Templeton.


