After a tumultuous year for capital markets in 2022, investors will likely face more uncertainty in 2023. However, there are several bright spots — inflation is beginning to moderate, central banks are slowing the pace of tightening and fixed income valuations are now attractive across many sectors.
Against this backdrop, emerging market debt (EMD) may warrant a closer look for European investors as it offers attractive yields relative to other fixed income asset classes with lower volatility than equity assets.
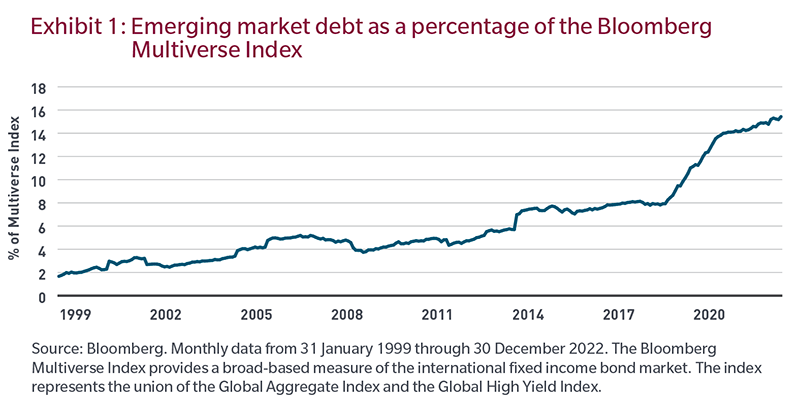
While emerging market investing is familiar to European investors, it is often underrepresented across portfolios. Much like emerging market equities, EMD allows investors to gain access to higher-growth and higher-productivity economies compared to developed market economies. Additionally, EMD has matured significantly as an asset class over the past 30 years. In the early 1990s, there were few countries in the index, and crises from the mid-1990s to the early 2000s resulted in the asset class being perceived as a high-risk proposition. Today, many EMD issuers have robust debt profiles and better credit quality than in the past. Furthermore, the depth and breadth of liquidity has increased as the size of the overall market has grown to approximately €4.7 trillion,1 and EMD now comprises nearly 16% of the global bond universe.

Emerging market debt can be divided into two main sub-asset classes: hard currency and local currency. Hard currency EMD refers to debt issued primarily in USD but also in euro and yen. Local currency EMD refers to debt issued in the issuer's domestic currency. Hard currency EMD can be hedged back into euros or left unhedged. For local currency EMD, hedging the currencies is often impractical because it can be a complex and costly process.
What are the key portfolio characteristics of EMD?
In considering an allocation to EMD, it is important to understand the volatility and correlation characteristics of the asset class. It is often assumed that local currency EMD is more volatile than hard currency EMD. However, the volatility profile depends on the home currency of the investor. As shown in Exhibit 2, local currency EMD has exhibited higher volatility over the past 10 years for US investors,
averaging 11.4% as compared to hard currency EMD volatility of 9.0% over the same period. In euro terms, however, the volatility of local currency EMD has been much lower at 9.2%, comparable to unhedged
hard currency EMD, which also averaged 9.2%. Hedging the US dollar exposure from hard currency EMD reduced the overall volatility slightly to 9.0%.

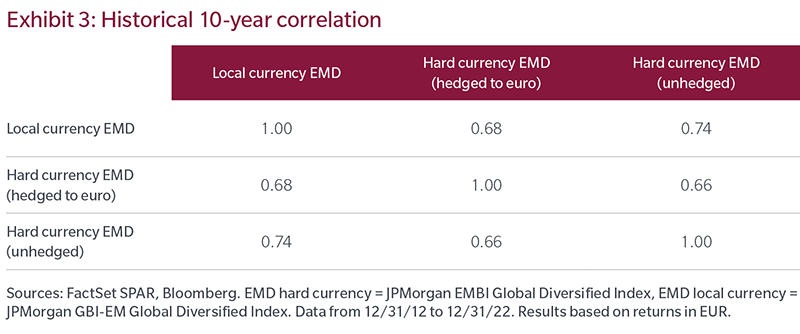
Exhibit 3 shows the correlations between the different EMD assets, and we see a potential diversification benefit between hard and local currency with a correlation of roughly 0.7, varying slightly depending on whether the hard currency is hedged to euros or not.

Assessing EMD in a euro investor's portfolio
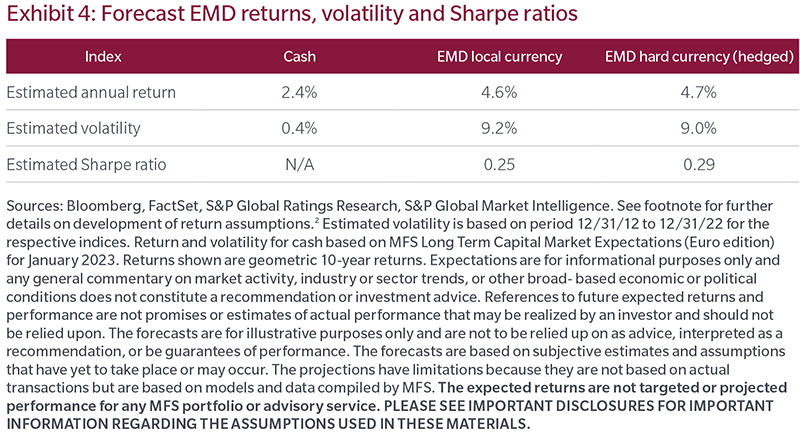
To analyze the potential benefits of adding EMD in a euro denominated portfolio, we estimated the potential returns that a euro-based investor might experience over the next 10-years. We started with current yields and then made adjustments for hedging costs, default rates and currency depreciation based on current market conditions. We then estimated volatility based on historical data and calculated expected Sharpe ratios, as shown in Exhibit 4.

Capital Markets View is for informational purposes only and any general commentary on market activity, industry or sector trends, or other broad based economic or political conditions does not constitute a recommendation or investment advice. The expected returns presented are hypothetical in nature and are not representative of an actual account. Certain assumptions have been made for modeling purposes and are unlikely to be realized. No representation or warranty is made as to the reasonableness of the assumptions made or that all assumptions used in calculating returns have been stated or fully considered. Projections and forward- looking assumptions are no guarantees of future performance. The expected returns are not targeted or projected performance for any MFS portfolio or advisory service.
Source: Bloomberg Index Services Limited. BLOOMBERG® is a trademark and service mark of Bloomberg Finance L.P. and its affiliates (collectively "Bloomberg"). Bloomberg or Bloomberg's licensors own all proprietary rights in the Bloomberg Indices. Bloomberg neither approves or endorses this material or guarantees the accuracy or completeness of any information herein, or makes any warranty, express or implied, as to the results to be obtained therefrom and, to the maximum extent allowed by law, neither shall have any liability or responsibility for injury or damages arising in connection therewith.
Information has been obtained from sources believed to be reliable, but J.P. Morgan does not warrant its completeness or accuracy. The Index is used with permission. The Index may not be copied, used, or distributed without J.P. Morgan's prior written approval. Copyright 2022, J.P. Morgan Chase & Co. All rights reserved.
Index data source: MSCI. MSCI makes no express or implied warranties or representations and shall have no liability whatsoever with respect to any MSCI data contained herein. The MSCI data may not be further redistributed or used as a basis for other indices or any securities or financial products. This report is not approved, reviewed or produced by MSCI.
"Standard & Poor's®" and S&P "S&P®" are registered trademarks of Standard & Poor's Financial Services LLC ("S&P") and Dow Jones is a registered trademark of Dow Jones Trademark Holdings LLC ("Dow Jones") and have been licensed for use by S&P Dow Jones Indices LLC and sublicensed for certain purposes by MFS. The S&P 500® is a product of S&P Dow Jones Indices LLC, and has been licensed for use by MFS. MFS's Products are not sponsored, endorsed, sold or promoted by S&P Dow Jones Indices LLC, Dow Jones, S&P, or their respective affiliates, and neither S&P Dow Jones Indices LLC, Dow Jones, S&P, their respective affiliates make any representation regarding the advisability of investing in such products.
The views expressed are those of the author(s) and are subject to change at any time. These views are for informational purposes only and should not be relied upon as a recommendation to purchase any security or as a solicitation or investment advice. No forecasts can be guaranteed.
Unless otherwise indicated, logos and product and service names are trademarks of MFS® and its affiliates and may be registered in certain countries.
Distributed by: U.S. - MFS Institutional Advisors, Inc. ("MFSI"), MFS Investment Management and MFS Fund Distributors, Inc.; Latin America - MFS International Ltd.; Canada - MFS Investment Management Canada Limited. No securities commission or similar regulatory authority in Canada has reviewed this communication; Note to UK and Switzerland readers: Issued in the UK and Switzerland by MFS International (U.K.) Limited ("MIL UK"), a private limited company registered in England and Wales with the company number 03062718, and authorised and regulated in the conduct of investment business by the UK Financial Conduct Authority. MIL UK, an indirect subsidiary of MFS®, has its registered office at One Carter Lane,
London, EC4V 5ER. Note to Europe (ex UK and Switzerland) readers: Issued in Europe by MFS Investment Management (Lux) S.à r.l. (MFS Lux) - authorized under Luxembourg law as a management company for Funds domiciled in Luxembourg and which both provide products and investment services to institutional investors and is registered office is at S.a r.l. 4 Rue Albert Borschette, Luxembourg L-1246. Tel: 352 2826 12800. This material shall not be circulated or distributed to any person other than to professional investors (as permitted by local regulations) and should not be relied upon or distributed to persons where such reliance or distribution would be contrary to local regulation; Singapore - MFS International Singapore Pte. Ltd. (CRN 201228809M); Australia/New Zealand - MFS International Australia Pty Ltd ("MFS Australia") (ABN 68 607 579 537) holds an Australian financial services licence number 485343. MFS Australia is regulated by the Australian Securities and Investments Commission.; Hong Kong - MFS International (Hong Kong) Limited ("MIL HK"), a private limited company licensed and regulated by the Hong Kong Securities and Futures Commission (the "SFC"). MIL HK is approved to engage in dealing in securities and asset management regulated activities and may provide certain investment services to "professional investors" as defined in the Securities and Futures Ordinance ("SFO").; For Professional Investors in China - MFS Financial Management Consulting (Shanghai) Co., Ltd. 2801-12, 28th Floor, 100 Century Avenue, Shanghai World Financial Center, Shanghai Pilot Free Trade Zone, 200120, China, a Chinese limited liability company registered to provide financial management consulting services.; Japan - MFS Investment Management K.K., is registered as a Financial Instruments Business Operator, Kanto Local Finance Bureau (FIBO) No.312, a member of the Investment Trust Association, Japan and the Japan Investment Advisers Association. As fees to be borne by investors vary depending upon circumstances such as products, services, investment period and market conditions, the total amount nor the calculation methods cannot be disclosed in advance. All investments involve risks, including market fluctuation and investors may lose the principal amount invested. Investors should obtain and read the prospectus and/or document set forth in Article 37-3 of Financial Instruments and Exchange Act carefully before making the investments.


