
The Guinness Global Equity Income Fund currently holds nine high-quality US and European Industrial names. These account for c.24.3% of the portfolio (vs 10.7% for the MSCI World Index), making Industrials the Fund's second largest sector overweight. Here we discuss the sector's performance and quality characteristics, and three key trends shaping its outlook.

This overweight is a function of our bottom-up process (where we seek to identify high-quality companies, with consistently high returns on capital, strong balance sheets and a growing dividend). However, we also view the Industrials sector favourably given its range of attractive characteristics and emerging secular growth drivers. In this update, we will explore the sector in more detail, outline the characteristics of our current holdings, and look ahead to the tailwinds that are driving the sector.
The Fund's nine industrial names span many different use cases, from power management to grid infrastructure, industrial compressors to robotics and even EV powertrains, aerospace components, and dishwashers. The range is broad and the end markets varied. Given this wide exposure, the Industrials sector is often perceived as a barometer for the health of the broader economy.
How has the sector performed?
Over the past two years, Industrials have performed particularly well. From June 2022 to June 2024, the MSCI World Industrials Index has returned +48.2%, outpacing the MSCI world (+43.9%) in USD.
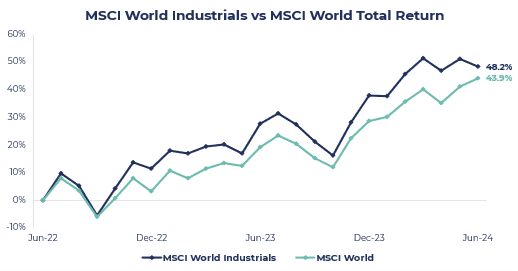
Source: Bloomberg, MSCI as of 30th June 2024
This performance has been particularly impressive when looking at attribution by sector. As discussed in many prior commentaries, Information Technology has played a dominant role in driving index returns over the past ~2 years, which has led the index higher. The chart below illustrates the dominant performance of the Industrials sector, outperforming all other sectors other than Communication Services & IT.
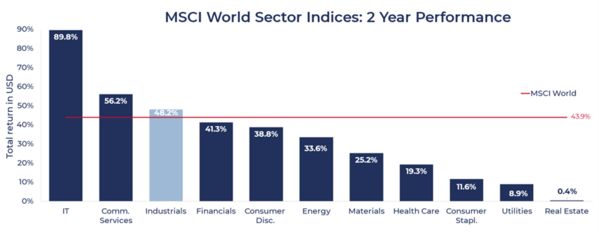
Source: Bloomberg, MSCI as of 30th June 2024
Industrials: the Best of the Rest
Taking this one step further, within the IT sector, it has been a handful of large-cap technology stocks that have skewed returns at the index level. If we take the S&P 500 return over the past two years and exclude performance from the "Magnificent 6" (Amazon, Apple, Google, Meta, Microsoft, Nvidia) we are left with the sector returns from the remaining 494 names.
This is illustrated by the grey bars in the chart below. Excluding these six names, that Industrials have outperformed all other sectors, in other words making them the ‘best-of-the-rest".
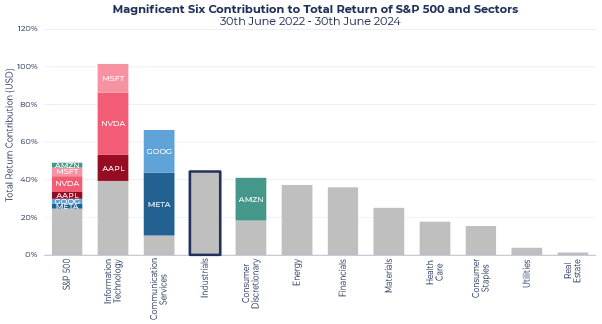
Source: Bloomberg, MSCI as of 30th June 2024
Industry groups
Whilst the temptation is to focus on Industrials as a whole, the sector is in fact very varied. The Global Industry Classification Standard (GICS) breaks it down into three industry groups:
1. Capital Goods
2. Commercial & Professional Services
3. Transportation
With different remits and different end markets, each industry group displays different growth and quality characteristics.
Global Equity Income Fund Industrial Holdings
Source: MSCI GICS, as of 30th June 2024
The allocation chart above shows that all Fund industrial revenues are derived from either Capital Goods or Commercial & Professional Services, with more weighting to the former. No revenues come from Transportation.
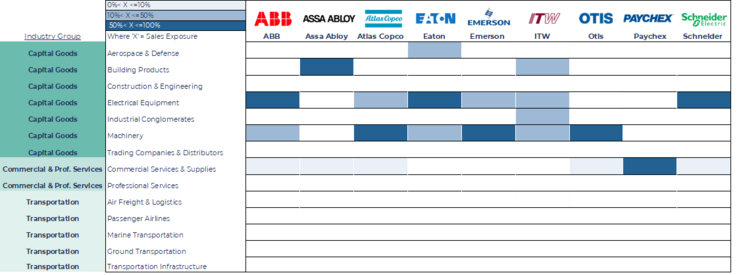
Within these industry groups, it is also noteworthy that Electrical Equipment (including electrical components, cables, grid infrastructure etc), Machinery (heavy-duty tools, construction equipment, compressors, elevators) and Commercial Services (payroll & HR software, ancillary service revenues) are the industries with the largest overweight allocations. Again, it is worth stressing that this is a result of our bottom-up stock selection process. However, when delving into the sub-group characteristics, it is evident that some areas provide more attractive investment opportunities due to superior quality and growth characteristics.
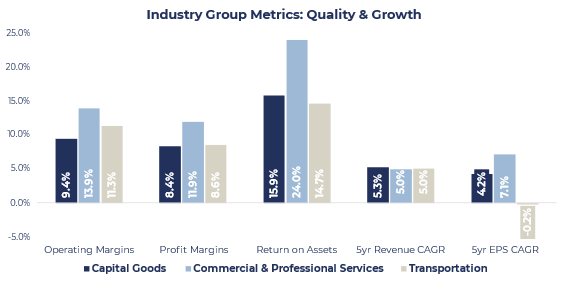
Industry Groups Explored: CapGoods In, Transport Out
As noted above, each industry group can vary substantially:
- Margins: The generally leaner and more asset-light Commercial & Professional Services segment has a superior margin profile to both Capital Goods and Transportation.
- Returns: this is also the case when looking at returns. Commercial & Professional Services show superior return on assets as the focus on providing services with minimal need for capital-intensive spending generally leads to more favourable return metrics.
- Growth: All three industries have been growing revenues at c.5% over the past five years, but, encouragingly, the two industry groups where the Fund has exposure have seen far better earnings growth. Conversely, Transportation has seen earnings fall over a five-year period, which may be due to inherent industry volatility with notable recent examples of the pandemic and conflict-affected supply chains both causing substantial disruptions.
Source: Bloomberg, Credit Suisse Holt as of 30th June 2024
When looking at Cash Flow Return on Investment (CFROI), a return metric that measures the cash generated by a company's operations relative to its investment base, the difference in quality between the industry groups becomes more apparent. As expected, Services generates a superior CFROI, but even though Capital Goods and Transportation both have fairly capital-intensive business models, the former has a clearly superior CFROI profile over the period shown.
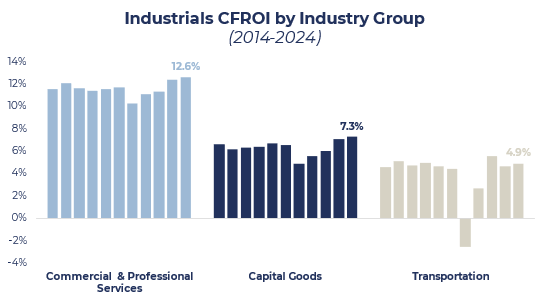
Source: Credit Suisse Holt as of 30th June 2024
It is therefore perhaps unsurprising that given the superior quality and growth metrics (particularly the 5-year earnings growth rate), Capital Goods and Commercial & Professional Services have outperformed Transportation in performance terms (by over 50% since 2019). It is also noteworthy that Capital Goods (the Fund's largest overweight) was the best performer over this period and demonstrated lower volatility.
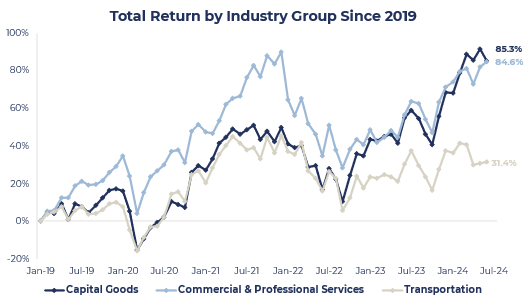
Source: Bloomberg, as of 30th June 2024
Cyclicality
Industrials are noted for being a cyclical sector, impacted by broader macroeconomic cycles, but also affected by smaller cycles of extended and retracted demand, based on inventory levels, company investment, and monetary policy. At present, the consensus is for a wider Industrial slowdown in 2024 as higher interest rates affect capital investment decisions and the post-pandemic investment boom fades. However, when looking back over the past 30 years, this appears inherently normal. The chart below shows the percentage change in Sector revenues, split out by industry group.
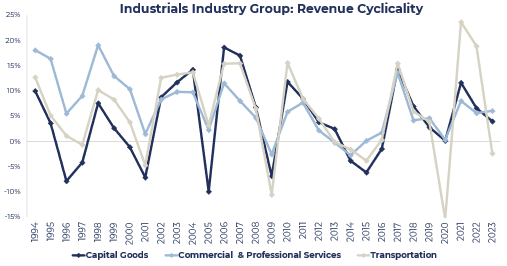
Source: Credit Suisse Holt as of 30th June 2024
- Transportation appears to show the most cyclicality, particularly over the past decade, where global exogenous shocks have caused pronounced supply chain disruptions for airlines, shipping, and logistics firms.
- Capital Goods: During economic expansions, businesses invest heavily in new equipment and infrastructure, but non-essential capex is often the first to be cut (or delayed) during downturns. However, enduring growth drivers (see section below) seem to have dampened volatility over the past decade.
- Services is the least cyclical group as many firms have a high proportion of recurring revenues and often have more sticky customers. Some of the Fund's Industrial holdings generate a significant portion of revenues from essential service contracts (incl. machine maintenance and repair) which are therefore less susceptible to macro conditions given their fixed nature.
The Fund's Industrial Holdings
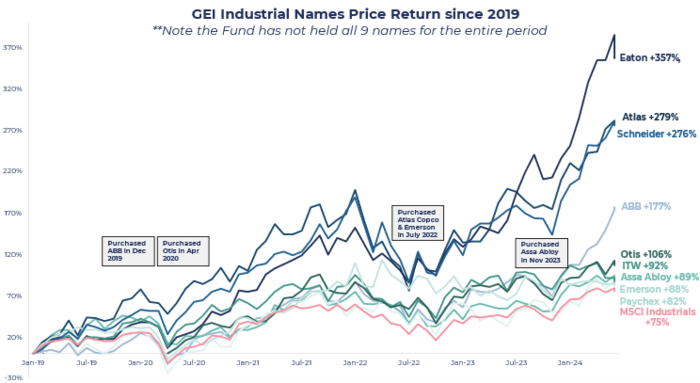
Source: Bloomberg, as of 30th June 2024
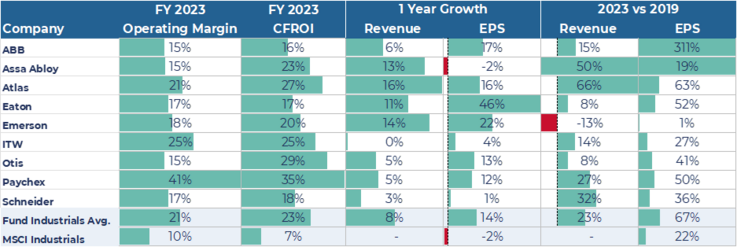
The nine current Industrial holdings in the Fund all exhibit high returns on capital, healthy margin profiles, strong balance sheets, dividends supported by growing free cash flows as well as an encouraging growth outlook. The combination of these factors helps to explain their good performance over the past five years and more. The superior quality and growth characteristics are shown in the table below. While there are no revenue growth figures for the Index, an average of 23% revenue growth since 2019 across the nine holdings and 57% average earnings per share growth (vs 22% for the index) shows the strong tailwinds supporting the Fund's Industrial names.
Source: Bloomberg, as of 30th June 2024
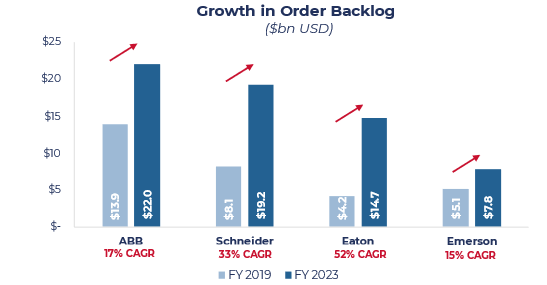
Backlog
Backlog, a key indicator for the sector, refers to orders that are yet to be executed on but remain in the pipeline. They give visibility into the forward demand picture and can be used to forecast future revenues. Some firms receive orders months or even years in advance, due to the long-term planning going into future projects. While it is normal to operate with some backlog against which to execute, the industry is currently at elevated levels. This is due to strong demand for Industrial goods but is also exacerbated by bottlenecks (supply chain disruptions and tight labour markets) which have caused backlogs to build. These are forecast to ease going forward, as ‘just in case' inventories are liquidated and supply chains normalise, but there is nonetheless a clear trend of growing backlogs in the sector which gives us good insight into the growth outlook for many Industrial firms. Not all companies report their backlog figures. The build-up for those Fund holdings that do (ABB, Eaton, Emerson, and Schneider) can be seen in the chart below.
Source: Company filings, as of 30th June 2024
Trends in Industrials
Industrials have historically been considered a relatively cyclical sector. Now, however, a handful of enduring secular growth trends are helping to change that narrative by driving more sustainable long-term earnings growth.
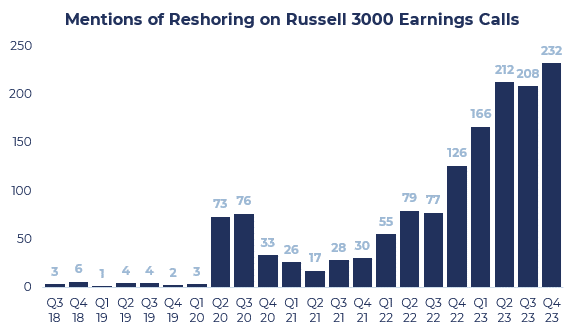
Trend 1: Onshoring
Trade tensions between the US and China gained momentum in 2018. The reintroduction of tariffs and greater protectionist measures signalled a new period of global trade relations and caused countries to rethink international supply chains. This was greatly exacerbated by the COVID-19 pandemic, since which firms have made a concerted effort to reduce supply chain complexity, limit overreliance on foreign manufacturing, and onshore more production domestically. While this investment has been costly and time consuming, it has caused a sustained increase in demand for capital goods and broader industrial products and services. The Zeitgeist is illustrated by mentions of reshoring or onshoring on Russell 3000 earnings calls.
Source: Bloomberg, as of 30th June 2024
Trend 2: Megaprojects
It is not just companies which are leading the charge to bring production back onshore. Governments are also getting involved in incentivising large-scale industrial transformation through so-called ‘megaprojects' (projects that cost over $1bn from start to finish). Industrial power management giant Eaton notes that there has been over $1.2tn in cumulative North American megaproject spend (or committed spend) since the start of 2021. Between 3-5% of this will go towards electrical content, which is a huge tailwind for the business and the electrical sector as a whole. Interestingly, 52% of this spend has come from US Federal Government Incentives alone, with landmark spending acts such as the Inflation Reduction Act (IRA) the Infrastructure Investment and Jobs Act (IIJA) and the Creating Helpful Incentives to Produce Semiconductors Act (CHIPS) all presenting a substantial tailwind for the sector. Two examples of the allocated funds can be seen via the IIJA and the IRA breakdowns below.
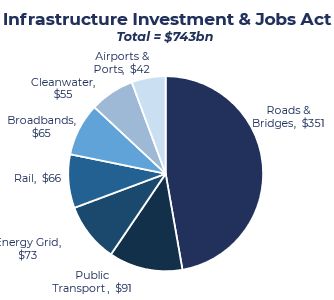
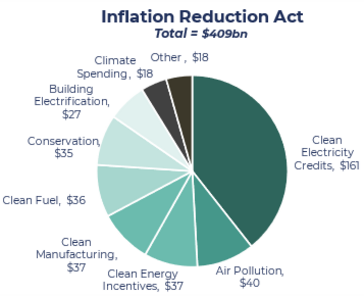
Source American Council of Engineering Companies and Congressional Budget Office, as of 30th June 2024
It is worth noting this is not just an American phenomenon. There is an estimated c.$500bn of large-scale project orders in Europe, with industrial firms equally as constructive about the outlook for ex-US geographies. Furthermore, only about 15% of the aggregate megaproject spend announced so far has found its way into company sales; the rest is in backlog or yet to be formalised, as many of these projects remain in the pipeline planning phase. This demand should feed through over the coming five years, presenting a substantial growth tailwind for the industry that shows no signs of abating.
Trend 3: M&A
The trends above and the changing global landscape have led to a fast-moving and dynamic industry. Some sectors have seen an explosion in demand whilst others have lagged. Notable winners include Data Centres (fuelled by the AI boom), Energy Infrastructure (due to the climate transition) as well as Aerospace & Defence (given growing global conflicts and geopolitical tension). The Fund's nine Industrial names have diversified exposure at present, but active M&A over the coming decade will help reposition their portfolios to further benefit from these high-profile megatrends. M&A activity levels have contracted over 2023 and H1 2024 as higher interest rates have curtailed deal volumes. However, easing monetary policy over the coming 12 months should be constructive for global M&A deal flow, and Industrial & Services firms are likely to take advantage as they embark on further portfolio transformations. The chart below shows both global M&A deal volume and deal value, which is forecast to rebound to 2021 highs as interest rates start to fall.
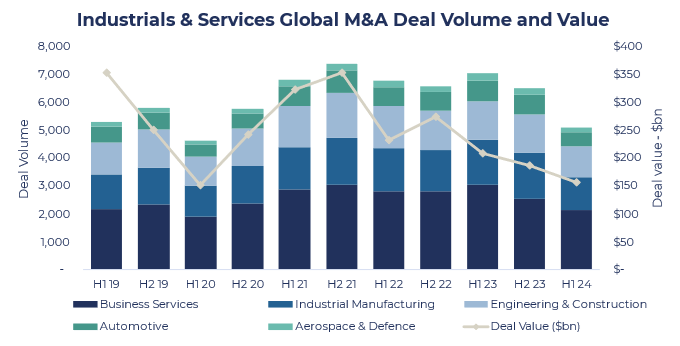
Source: LSEG and PwC analysis of 30th June 2024
The Guinness Global Equity Income Fund is an equity fund. Investors should be willing and able to assume the risks of equity investing. The value of an investment and the income from it can fall as well as rise as a result of market and currency movement, and you may not get back the amount originally invested. Further details on the risk factors are included in the Fund's documentation, available on our website (guinnessgi.com/literature). This Insight may provide information about Fund portfolios, including recent activity and performance and may contain facts relating to equity markets and our own interpretation. Any investment decision should take account of the subjectivity of the comments contained in the report. This Insight is provided for information only and all the information contained in it is believed to be reliable but may be inaccurate or incomplete; any opinions stated are honestly held at the time of writing but are not guaranteed. The contents of this Insight should not therefore be relied upon. It should not be taken as a recommendation to make an investment in the Funds or to buy or sell individual securities, nor does it constitute an offer for sale.